Flares CRM · Reporting
What the pipeline is actually doing.
Not a reporting project. The numbers come from the same records your team works in every day, so they are current by definition and nobody spends Friday assembling them.
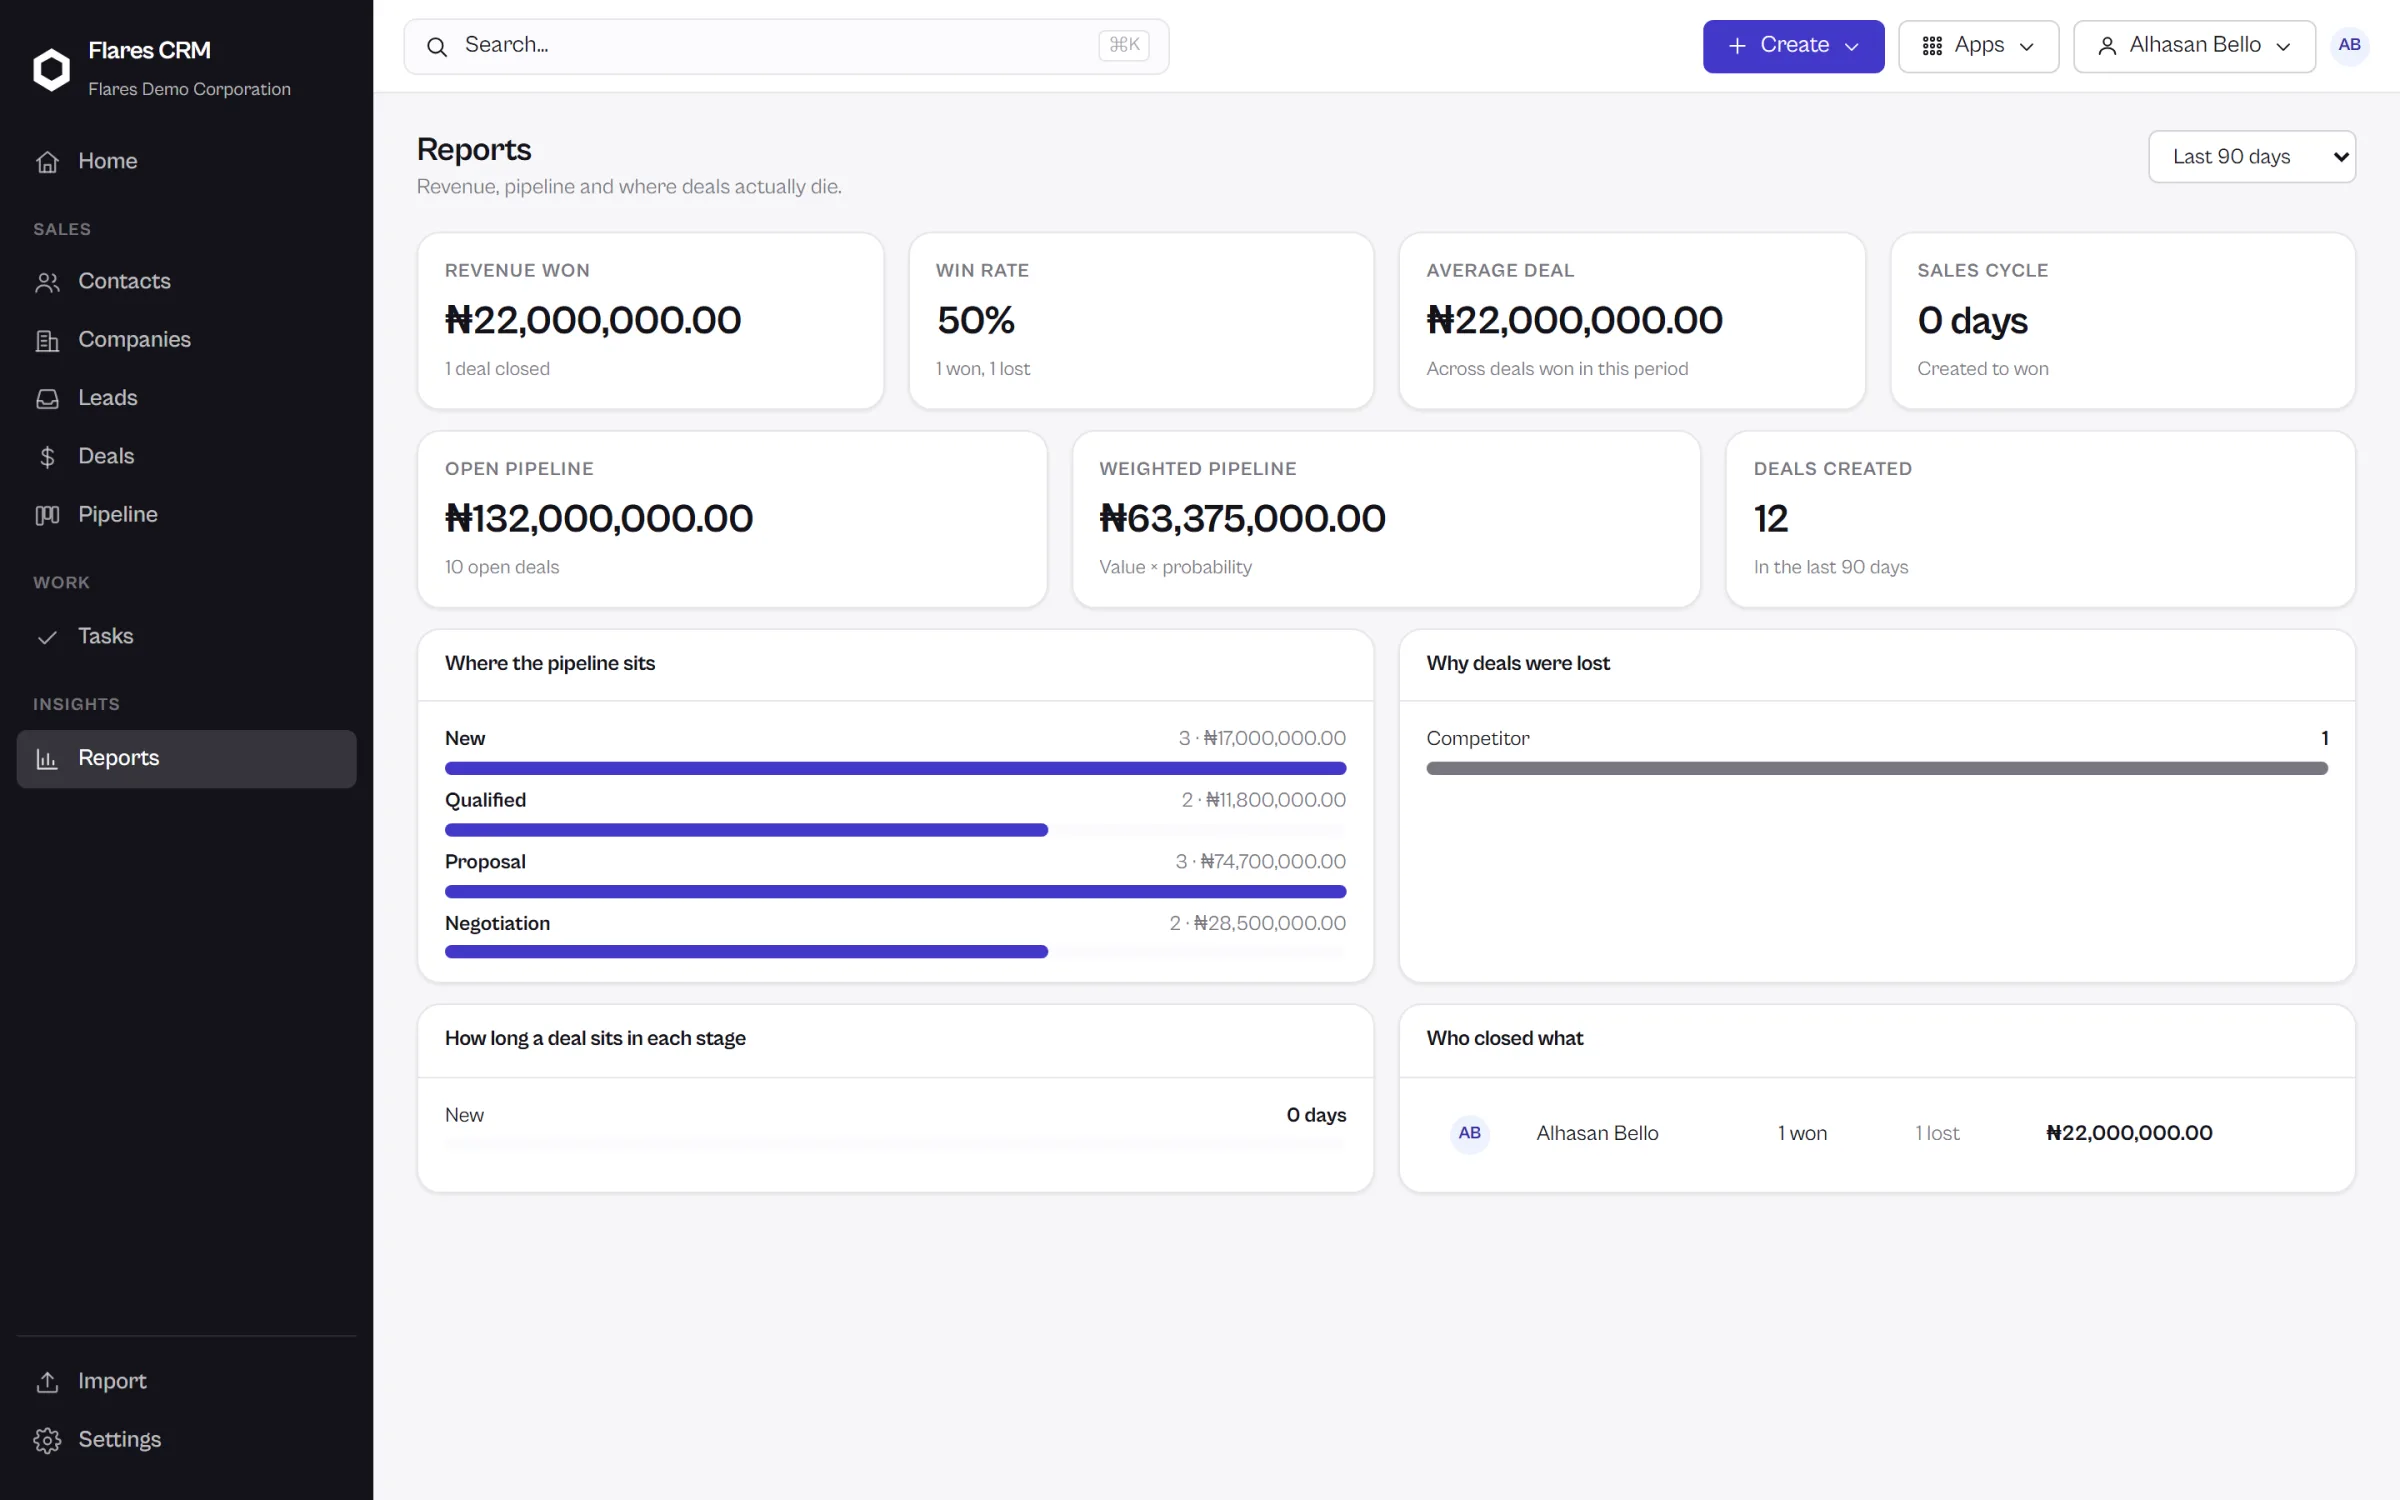
The headline numbers
Six figures that tell you where you are.
Over the last 30 days, 90 days, six months or twelve — whichever period you pick.
Revenue won
What actually closed in the period, in money.
Win rate
Of the deals that reached a decision, the share that went your way.
Average deal
What a typical win is worth, which is what makes a pipeline target meaningful.
Sales cycle
How long a deal takes from opening to closing, measured from the deals themselves.
Open pipeline
Everything still live, at full value.
Weighted pipeline
The same pipeline adjusted for where each deal has reached — a more honest number to plan against.
Where the pipeline sits
And where it stops moving.
Stage by stage
How much is sitting in each stage, and how long deals typically stay there. A stage that quietly holds deals for six weeks is a thing you want to know about while you can still act on it.
- Value held in each stage of the pipeline
- How long a deal sits in a stage, on average
- Deals that have gone quiet, surfaced rather than buried
Losses and people
Why deals were lost, and who closed what.
Why deals were lost
Because closing a deal as lost records a reason, the reasons add up into a report — and a pattern you can do something about.
Who closed what
Wins by owner over the period. A record of what happened, drawn from the deals themselves.
What you see
Reporting follows access.
A sales rep’s report covers the customers they own. A manager, an executive or RevOps sees the team’s. That is the same rule the lists and the search obey — it is not re-implemented for reporting, so it cannot disagree with itself.
See your own numbers
The reporting is a view of the work. Start using the CRM and it fills itself in.